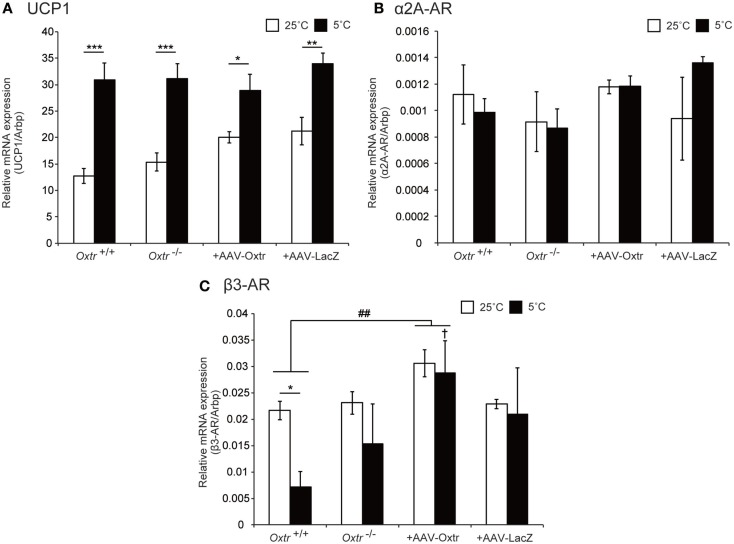
Figure 4.
Expression level of thermoregulation-related genes in BAT were quantified in Oxtr+/+, Oxtr−/−, +AAV-Oxtr, and +AAV-LacZ mice. (A) UCP1, (B) α2A-AR, and (C) β3-AR expression were measured by quantitative PCR analysis. Mice used for the preparation of mRNA were treated in 25 and 5°C conditions (n = 5 for each groups and conditions). * p < 0.05, ** p < 0.01, *** p < 0.001, compared with 25°C condition; †, p < 0.05, compared with Oxtr+/+ mice; ##, p < 0.01, significant difference between groups.

