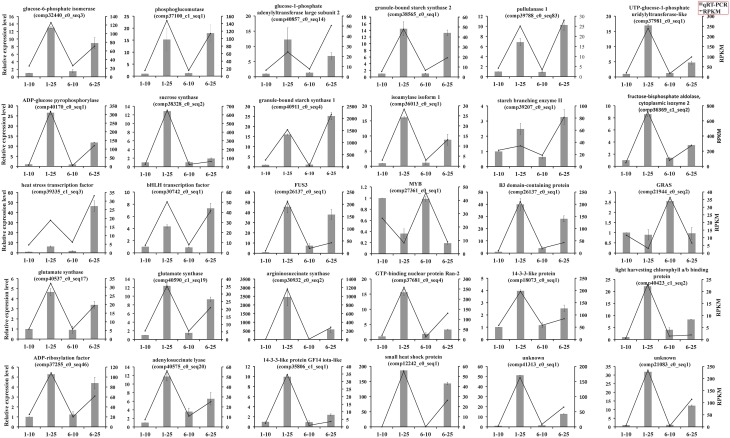
Figure 5.
qRT-PCR analysis of 30 differential expressed unigenes during seed development of vegetable pea and grain pea. The expression patterns of selected genes were analyzed at 10 and 25 DAP. Black bars with standard errors represent the relative expression level determined by qRT-PCR from three independent biological replicateds (left y-axis). Lines indicate transcript abundance change based on RPKM values according to RNA-Seq (right y-axis).

