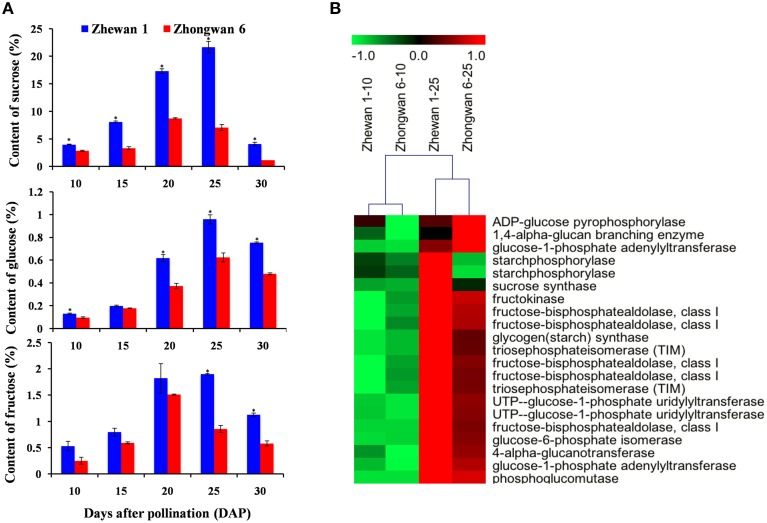
Figure 6.
Contents of sugars (sucrose, glucose and fructose) (A) and differential expression of genes for sugar biosynthesis (B) in Zhewan 1 and Zhongwan 6 during seed development. Mean sugar contents are shown with standard errors bars from three repeated experiments. Asterisk indicates that sugar content is significantly different between Zhewan 1 and Zhongwan 6 according to an LSD test at P < 0.05.

