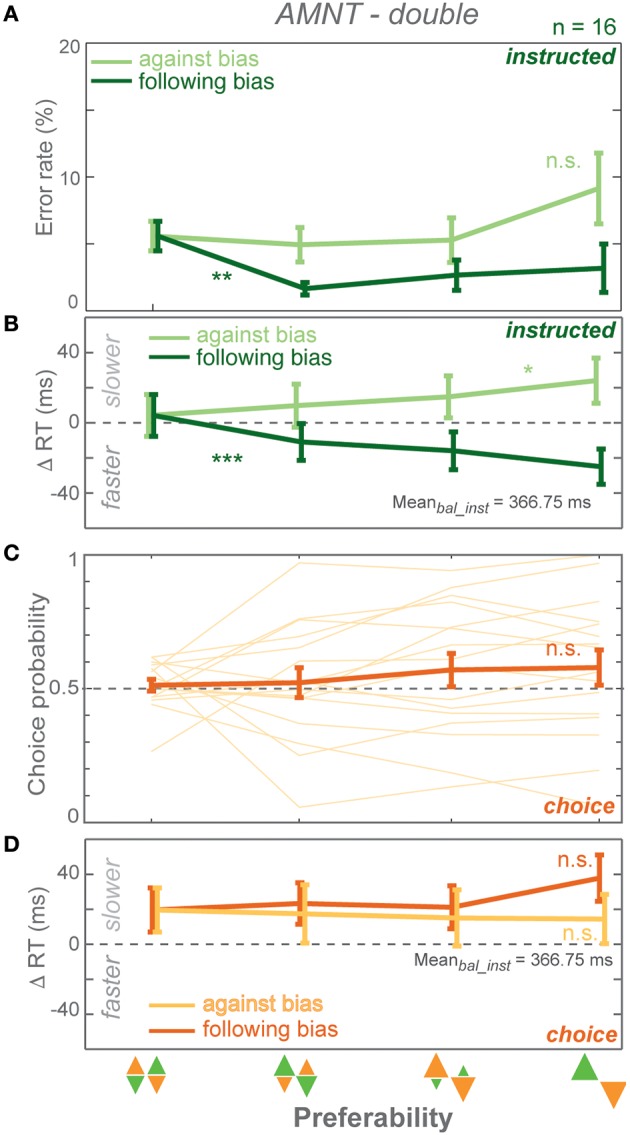
Figure 4.

Results of AMNT task with double reward size (AMNT-double). (A) Average error rates, (B) average instructed RT difference, (C) Choice probabilities, (D) average choice RT difference (zero line indicates average RTs in instructed trials of zero-bias condition of each task) in all bias levels. Dark and light colors represent follow and against responses, respectively. Error bars represent standard errors. (* p < αcorr at 5%, ** p < αcorr at 1%, *** p < αcorr at 0.1%).
