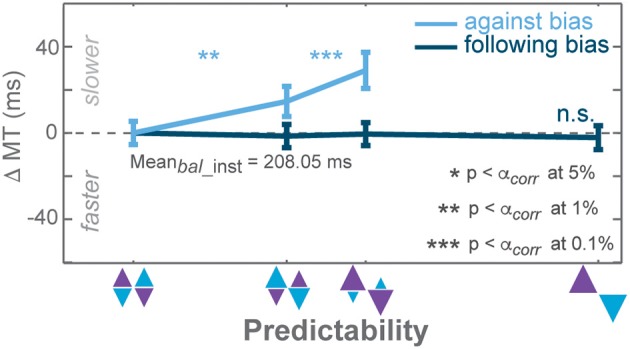
Figure 6.

Biasing effects on movement times (MT) instructed against trials of the PROB task. Zero line indicates average MTs in instructed trials of zero-bias condition. Dark and light colors represent follow and against responses, respectively. Error bars depict standard errors. (* p < αcorr at 5%, ** p < αcorr at 1%, *** p < αcorr at 0.1%, paired t-test with Bonferroni correction).
