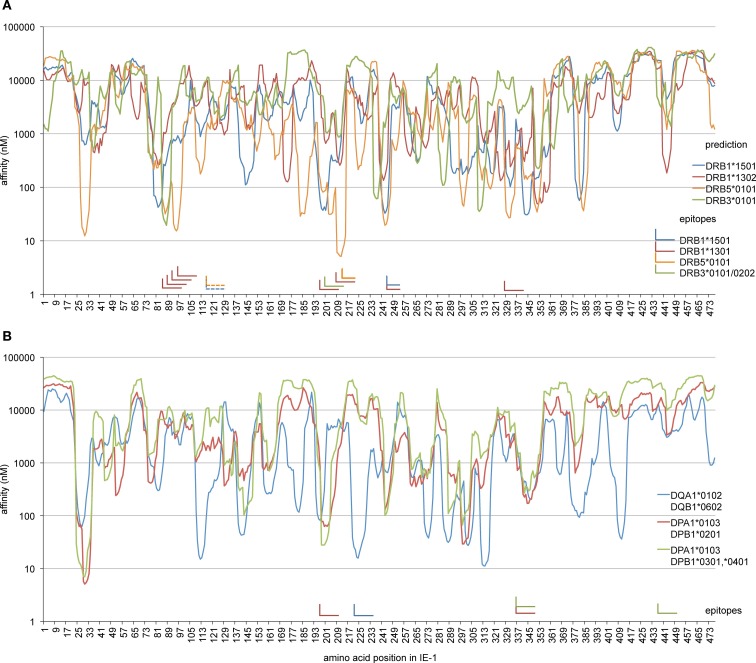
Figure 6.
Comparison of HLA binding predictions and confirmed epitopes. The NetMHCII 2.2 algorithm was used to calculate predicted binding affinities (nM) along the IE-1 sequence for those allotypes that were restriction elements of epitopes identified in this study. Curves show predicted affinities in nanomolar for each 15-mer whose N terminus is located at the IE-1 amino acid position indicated on the x-axis. “L” shapes represent confirmed IE-1 epitopes. The horizontal arm of each “L” indicates the position of reference on the x-axis, the vertical arm points at the position of reference in the prediction curves. One epitope with two possible HLA restrictions is represented as a pair of dashed “L” shapes. (A) Prediction for HLA-DR allotypes and confirmed DR-restricted epitopes. Since prediction for HLA-DR*1301 was not available in NetMHCII, HLA-DR*1302 is shown instead. (B) Prediction for available HLA-DQ and DP allotypes that match epitopes identified in this study, and the position of corresponding DQ- or DP-restricted epitopes.

