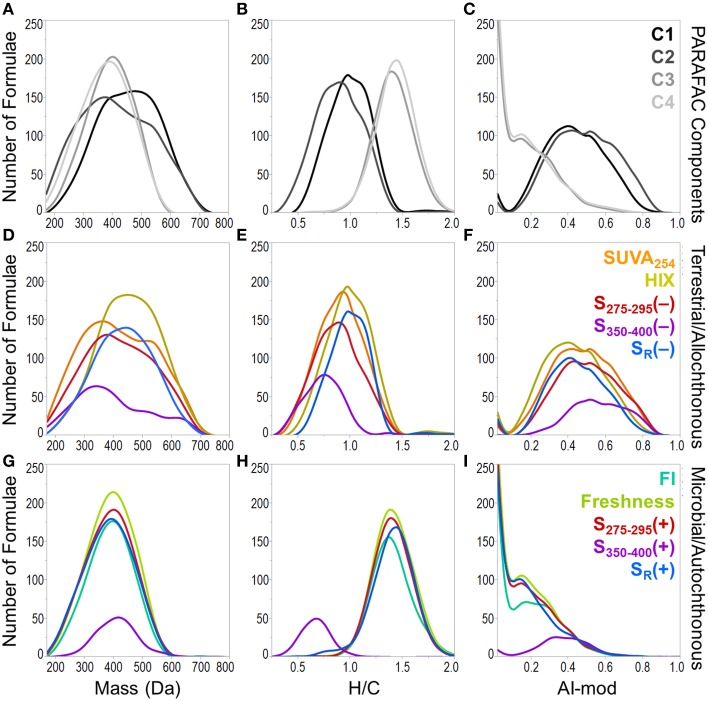
Figure 7.
Molecular mass (first column), H/C ratio (second column) and modified aromaticity index (AI-mod; third column) distributions of formulae associated with optical properties. Plots (A–C) show the distributions of formulae which positively correlated with PARAFAC components. Plots (D–F) show the distributions for optical properties which track with allochthonous or terrestrial-type DOM (formulae positively correlated with SUVA254, HIX and formulae negatively correlated with S275−295, S350−400, and SR). Plots (G–I) show the distributions for optical properties which track with autochthonous or microbial-type DOM (formulae positively correlated with FI, freshness index, S275−295, S350−400, and SR).

