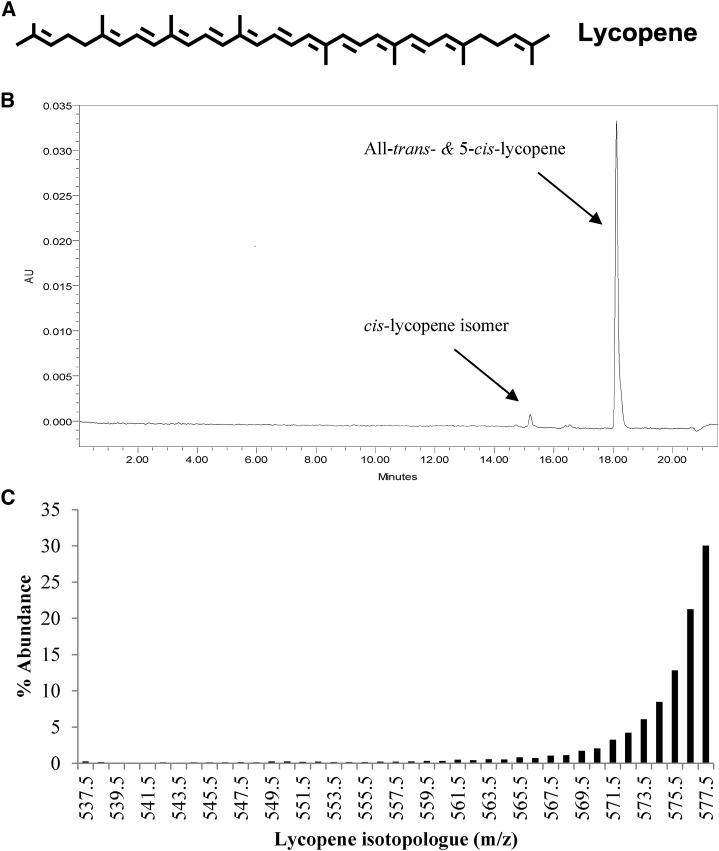
FIGURE 1.
Structure of lycopene (A), representative chromatogram of 13C-lycopene monitored at 470 nm (B), and the calculated 13C-isotopologue distribution in 13C-lycopene used for dosing (C). The percentage of isotopologue abundance was calculated from mass chromatogram peak areas of all-E + 5-Z-lycopene isotopologues masses from an m/z = 535.5 (the mass of unlabeled lycopene + 1 mass unit for H+ as a result of the analysis being conducted in positive ion mode) to m/z = 577.5 (the mass of uniformly labeled 13C-lycopene + 1 mass unit for H+ as a result of the analysis being conducted in positive ion mode). AU, arbitrary units.

