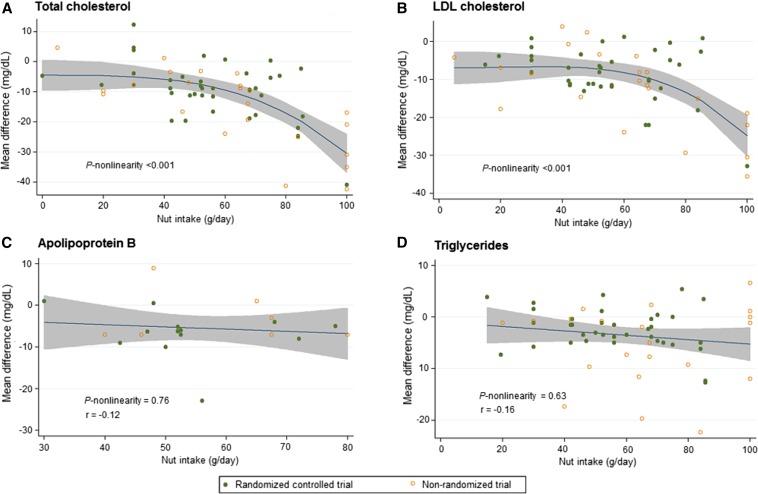
FIGURE 3.
Dose-response relations between tree nut intake (g/d) and absolute (unstandardized) mean difference (mg/dL) in total cholesterol (n = 61 trials) (A), LDL cholesterol (n = 61 trials) (B), apolipoprotein B (n = 19 trials) (C), and triglycerides (n = 59 trials) (D) (19–80). Nut intake lowers total cholesterol and LDL cholesterol in a nonlinear fashion (P-nonlinearity = 0.001 for both), with stronger effects observed above a nut dose of ∼60 g nuts/d. Linear dose-response relations were observed between nut intake and apolipoprotein B (r = −0.12) and triglycerides (r = −0.16). The 95% CI is depicted in the shaded regions.

