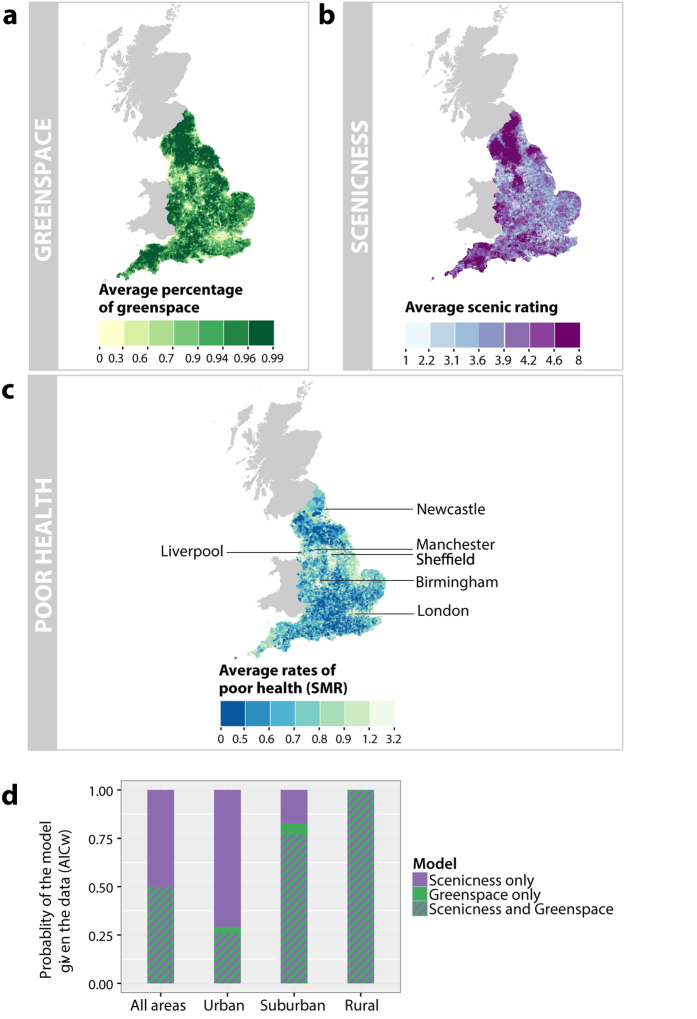
Figure 2. Scenicness, greenspace and health in England.
(a) Previous studies have suggested that greater amounts of greenspace are associated with reports of better health. We depict greenspace, utilizing Generalised Land Use Database 2005 green land cover data, at the level of English Lower Layer Super Output Areas (LSOAs) with quantile breaks. (b) We investigate how scenicness compares to greenspace, as scenicness and green land cover are significantly correlated (τ = 0.2, p < 0.001, N = 128,213, Kendall’s rank correlation). We calculate the average scenic rating of all Scenic-Or-Not photographs taken for each LSOA and depict these ratings using quantile breaks. Visual inspection of maps A and B reveals that, while the two measures are significantly correlated, there appear to be differences, for example in the East of England. (c) Respondents to the 2011 Census for England and Wales classified their health as “Very good or good”, “Fair” or “Bad or very bad”. We calculate health rates using the Standardized Morbidity Ratio (SMR), which is the ratio of the observed to the expected number of cases of bad health for a particular population, taking the age and gender of inhabitants into account. We depict the SMR for each LSOA using quantile breaks. (d) We investigate to what extent geographic differences in health can be explained by scenicness and greenspace, by creating Conditional Autoregressive (CAR) models where we also control for socioeconomic deprivation using data from the 2010 English Indices of Deprivation. To determine which model provides the best fit for predicting poor health, we calculate Akaike weights (AICw), which can be used to interpret the probability of each model given the data. Details on how AICw are calculated can be found in the Methods section. In all cases, we find that there is more evidence for models that include scenicness (denoted by purple or by purple and green stripes) than for the model with only greenspace (denoted by green). Maps created using the R packages rgdal and ggplot2. Contains National Statistics, NISRA, NRS and Ordnance Survey data © Crown copyright and database right 2013.

