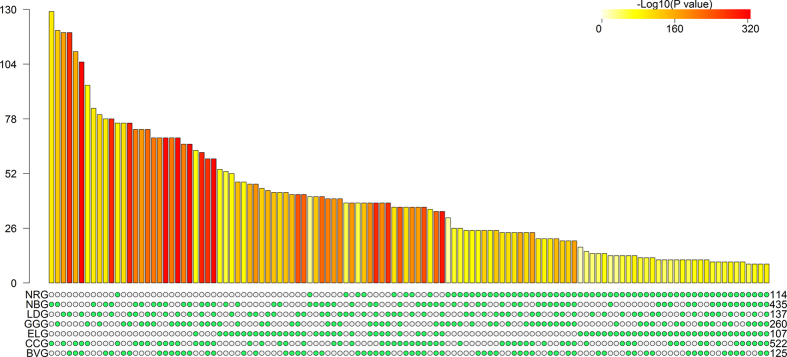
Figure 2. A bar chart illustrating all possible intersections among seven cancer gene sets in a matrix layout.
The matrix of solid and empty circles at the bottom illustrates the “presence” (solid green) or “absence” (empty) of the gene sets in each intersection. The numbers to the right of the matrix are set sizes. The colored bars on the top of the matrix represent the intersection sizes with the color intensity showing the P value significance.

