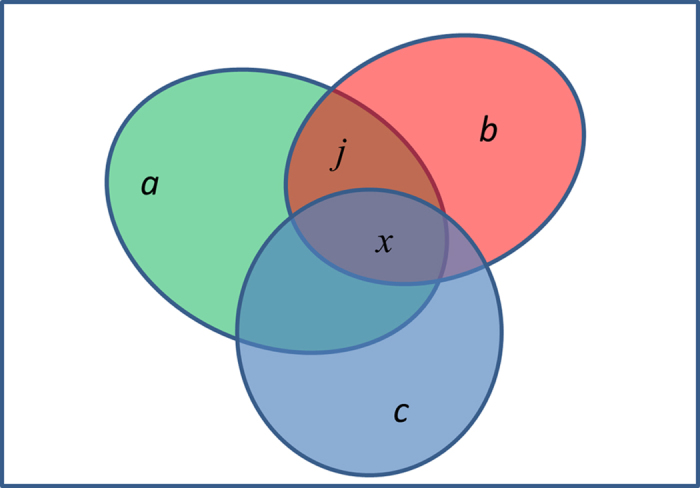
Figure 5. A Venn diagram showing intersection among three sets.

The box represents a population P of n elements and the three ellipses are three subsets A, B and C, with size a, b and c, respectively. A and B share j elements, among which x elements are also shared with C.
