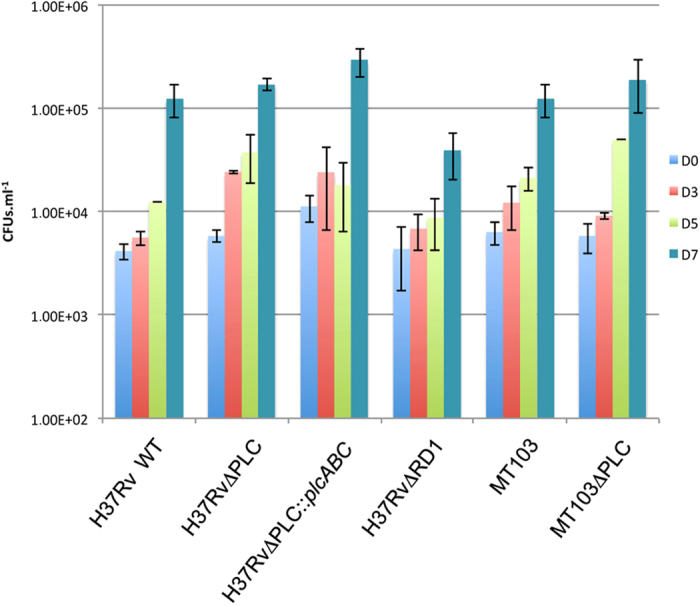
Figure 4. Growth kinetics of M. tuberculosis strains in THP-1 derived macrophages.

Number of colony forming units (CFU) obtained at different time points after infection. MOI was 1:20 (bacteria/cells). The figures show the means and the standard deviations obtained in 3 independent experiments.
