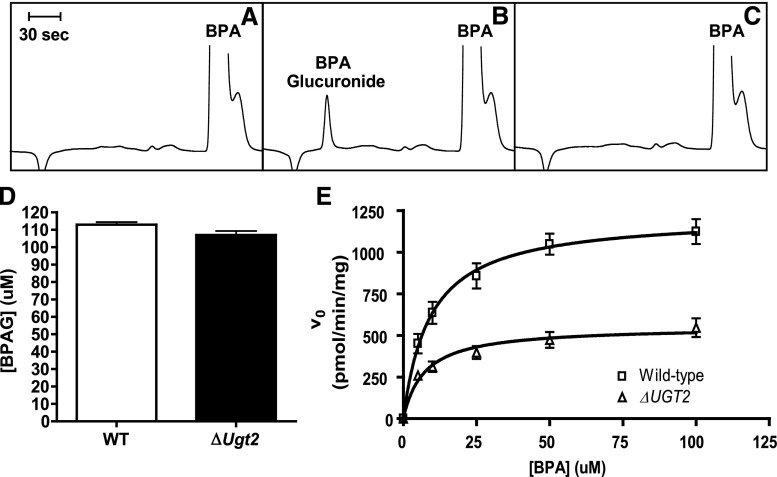
Fig. 5.
BPA glucuronidation by liver microsomes from WT and ΔUgt2 mice. (A) Typical chromatogram of products of a reaction terminated immediately after addition of UDPGA. (B) Typical chromatogram of products of a reaction terminated after 10 minutes of incubation. (C) The identity of the BPAG peak was verified by its loss after treatment with β-glucuronidase. (D) BPAG formation after 2-hour incubation of BPA and 25 µg/ml alamethicin with WT and ΔUgt2 microsomes. Complete substrate conversion was observed, and BPAG concentrations were not significantly different. (E) Michaelis-Menten curves for glucuronidation of BPA by microsomes prepared from WT (squares) and ΔUgt2 (triangles) mice in the absence of alamethicin. Each data point represents microsomal preparations from four mice. Error bars represent S.D. r2 > 0.95 for WT mice and r2 > 0.85 for ΔUgt2 mice. Reactions contained 20–60 µg microsomal protein, 5–100 µM BPA, and 5 mM UDPGA.

