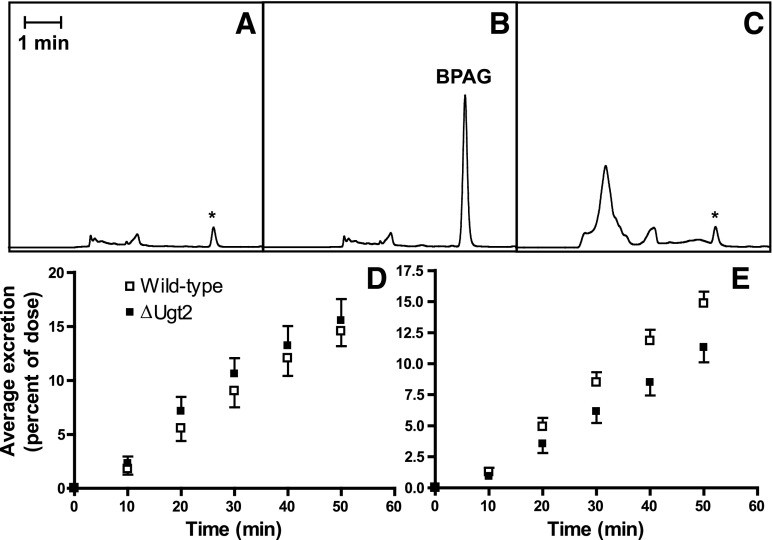
Fig. 7.
In vivo BPA glucuronidation in WT and ΔUgt2 mice. (A) Typical chromatogram of bile collected from a ΔUgt2 mouse prior to dosage. (B) Typical chromatogram of a bile fraction collected from a ΔUgt2 mouse from 0 to 10 minutes after dosage. (C) Treatment with β-glucuronidase causes loss of the BPAG peak and changes in the chromatographic profile due to deconjugation of endogenous glucuronides. BPAG peak areas were corrected for the area of a small interfering peak (presumably due to a co-eluting endogenous metabolite; marked by an asterisk) in bile obtained immediately before dosage. The interfering peak remained after β-glucuronidase treatment, indicating that it does not represent BPA exposure prior to experimentation. (D) Average BPAG excretion after dosage with 2 mg/kg BPA over the collection period for WT and ΔUgt2 male mice, measured as percentage of dose/minute. Average excretion rates for WT and ΔUgt2 mice were 0.306 ± 0.030 (mean ± S.E.M., n = 3) and 0.325 ± 0.039 (mean ± S.E.M., n = 3) respectively. (E) Average BPAG excretion after dosage with 20 mg/kg BPA over the collection period for WT and ΔUgt2 mice. Average excretion rates for WT and ΔUgt2 mice were 0.313 ± 0.019 (mean ± S.E.M., n = 6) and 0.224 ± 0.024 (mean ± S.E.M., n = 7) respectively. Average percent excretion/minute was significantly different at the P < 0.05 level in an unpaired Student’s t test. BPAG excretion was linear over the time range examined (plots of percent excretion versus time had r2 > 0.93 for all animals).

