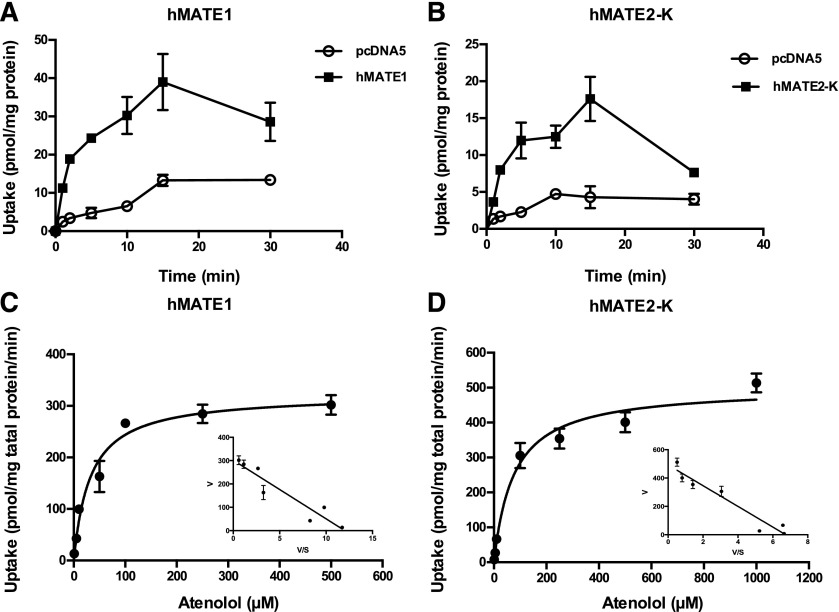
Fig. 4.
Atenolol uptake kinetics by hMATE1 and hMATE2-K. The uptake of 1 μM atenolol was measured in control and transporter-expressing HEK293 cells at specified time points (A and B). Concentration-dependent uptake of atenolol was measured in both transporter-expressing and control HEK293 cells after a 2-minute incubation at 37°C (C and D). Transporter-specific uptake was obtained by subtracting the uptake in the control cells from the uptake in the transporter-expressing cells. Data were fitted with the Michaelis-Menten equation using nonlinear regression. The insets are the Eadie-Hofstee transformation of the kinetics data. Each data point represents the mean ± S.D.

