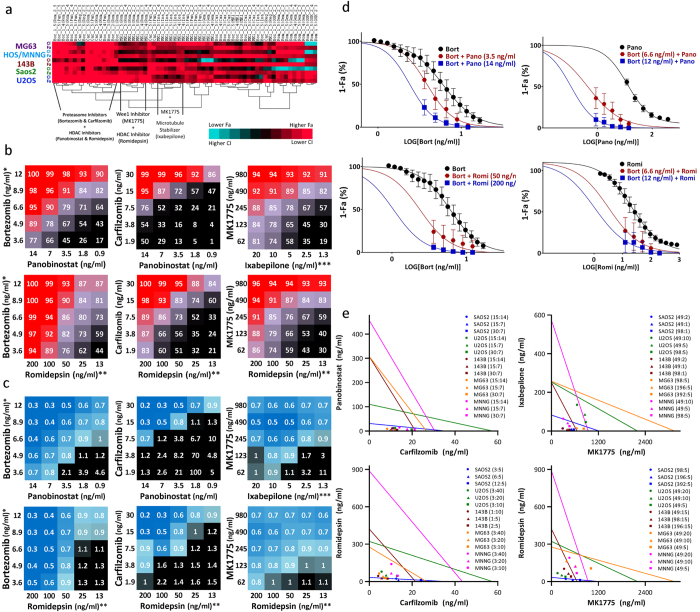
Figure 2. Combination screening results.
(a) clustering results showing top combination picks based on FA. (b) FA of the top 6 combinations evaluated in 5 osteosarcoma cell lines using CT-Glo viability assay. (c) CI of the top 6 combinations evaluated in 5 osteosarcoma cell lines using non-constant ratio CI method. (d) single and combination drug-response curves for bortezomib+panobinostat and bortezomib + romidepsin combinations. (e), isobologram analysis of carfilzomib + panobinostat, carfilzomib + romidepsin, MK1775 + ixabepilone, and MK1775 + romidepsin at ED90. *Alternative bortezomib concentrations used with MG63 (5.00, 3.70, 2.74, 2.03, 1.50 ng/mL). **Alternative romidepsin concentrations used with 143B (150, 75.0, 37.5, 18.8, 9.40 ng/mL); Saos2 (25.0, 12.5, 6.25, 3.13, 1.56 ng/mL). ***Alternative ixabepilone concentrations used with U2OS; MNNG/HOS (100, 50.0, 25.0, 12.5, 6.25 ng/mL); MG63 (25.0, 12.5, 6.25, 3.13, 1.56 ng/mL). The exact drug concentrations used are summarized in Supplemental Table S3.

