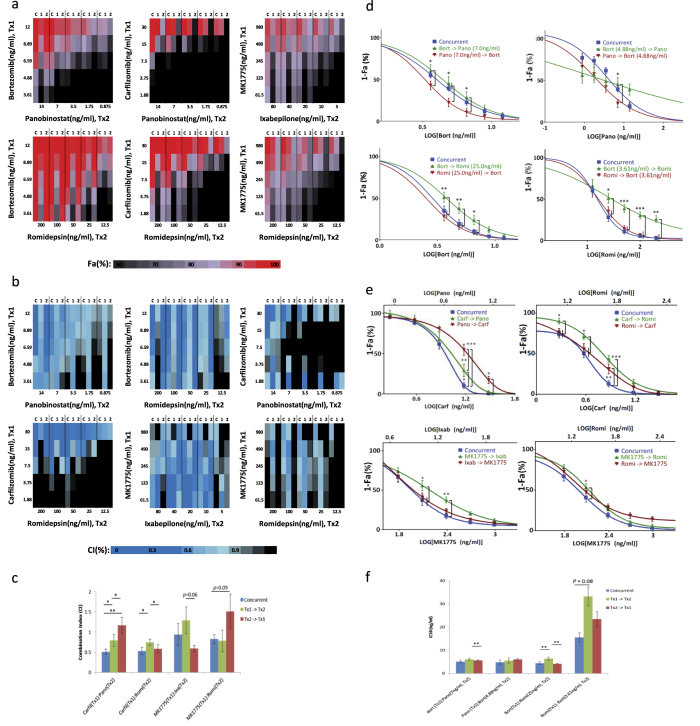
Figure 3. Order-of-addition analysis of the top 6 two-drug combinations assessed in 5 osteosarcoma cell lines FA (a) and CI (b) results using CT-Glo viability assay and non-constant ratio CI method, respectively.
C indicates concurrent treatment, 1: Tx1 given 24 hours prior to T × 2, 2: T × 2 given 24 hours prior to T × 1. (c) combination indices of carfilzomib:romidepsin, carfilzomib:panobinostat, MK1775:romidepsin, MK1775:ixabepilone in panel E averaged across ED80, ED85, ED90, ED95. (d) combination drug-response curves of bortezomib:romidepsin (top) and bortezomib:panobinostat (bottom) reported by CT-Glo. (e) combination drug-response curves of carfilzomib:romidepsin (3:20), carfilzomib-panobinostat (30:14), MK1775:romidepsin (98:20), MK1775:ixabepilone (98:8) reported by CT-Glo. (f) IC50 values of bortezomib:panobinostat and bortezomib:romidepsin combinations in panel A. Statistical comparison used two-way ANOVA with post-hoc Tukey test (d,e) and 2-tail paired t-test (c,f). *P < 0.05, **P < 0.01, ***P < 0.001).

