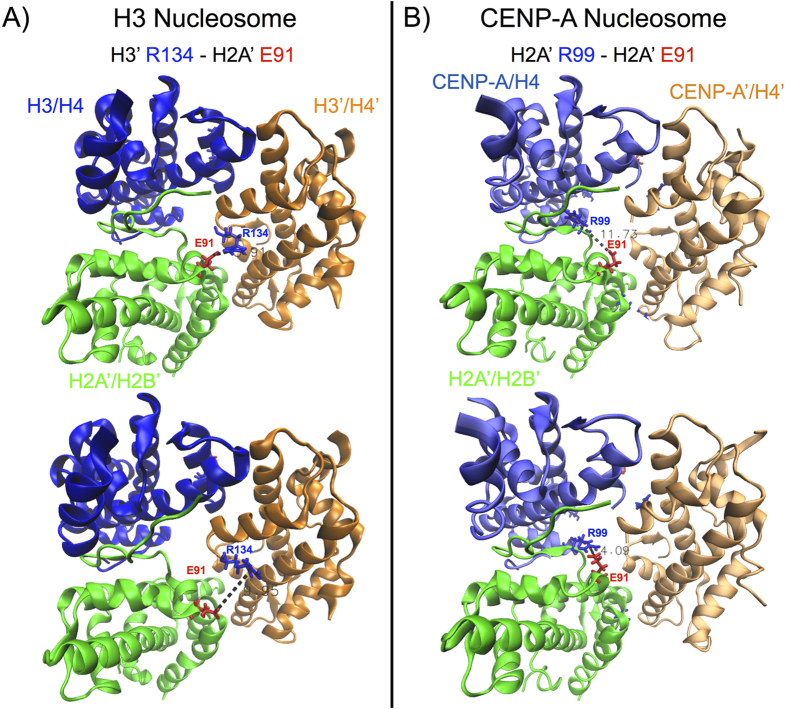
Figure 5. H2A’ acidic patch mobility depends on local, electrostatic interactions.
Representative simulation snapshots highlight electrostatic interactions contributing to the mobility of a region spanning the H2A’ acidic patch in (A) the H3 nucleosome, between H3′ Arg134 and H2A’ Glu91, and in (B) the CENP-A nucleosome, between H2A’ Arg99 and Glu91. Colored sticks represent positive residues (in blue) and negative residues (in red). Dashed lines measure the distances between the center of positive charge on the arginines, CZ, and the center of negative charge on the glutamic acid, CD. The surrounding superhelical DNA and the H2A/H2B dimers are removed to facilitate observation. Structure figures rendered in VMD.

