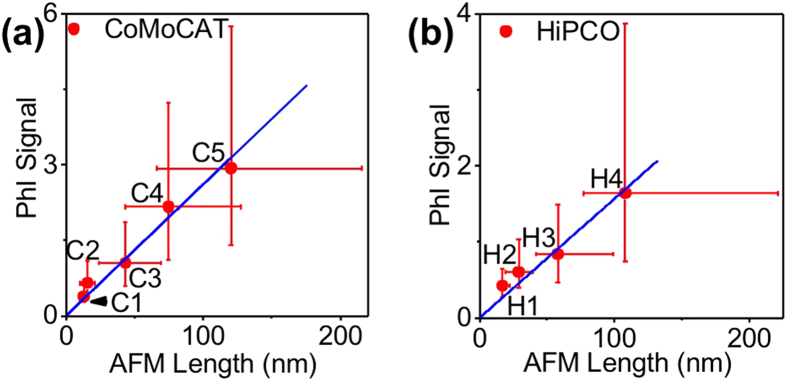
Figure 4.
(a) PhI signals (excitation at 568 nm) as a function of nanotube lengths measured by AFM, determined for usCNTs in fractions C2, C3, C4, and C5; Data points represent the median values of the distributions while the bars represent 25–75 percentiles of the distributions. The blue curve is a linear fit of the data. The length corresponding to fraction C1 is an extrapolation of the measurement provided by PhI analysis using the linear fit. (b) Same as in (a) for usCNTs in H1, H2, H3, and H4 fractions.

