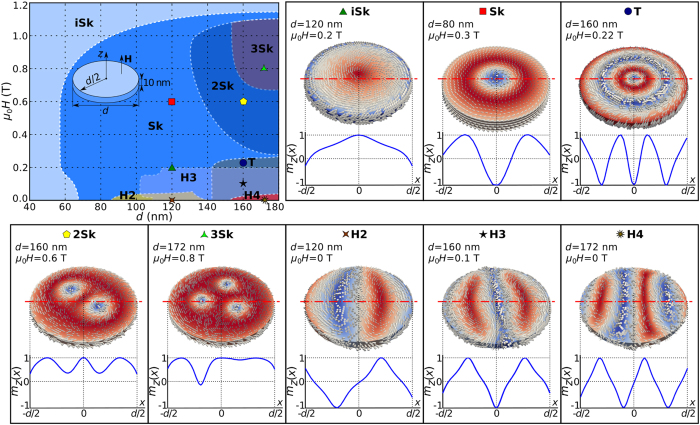
Figure 1. The metastability phase diagram and magnetisation configurations of all identified equilibrium states.
The phase diagram with regions where different states are in equilibrium together with magnetisation configurations and out-of-plane magnetisation component  along the horizontal symmetry line corresponding to different regions in the phase diagram.

