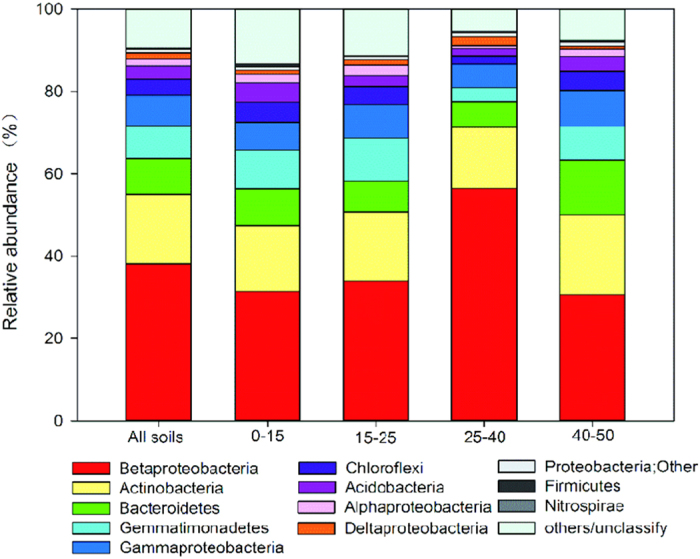
Figure 2. Relative abundance of the dominant bacterial phyla (or class in the case of the phylum Proteobacteria) in the sediments, separated according to sediment depth.

The relative abundances are based on the proportional frequencies of the DNA sequences that were classified at the phylum level.
