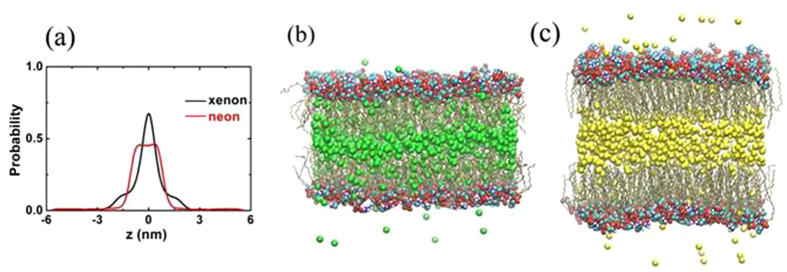
Figure 2. Results of 3 noble gas molecules per lipid system.
(a) Density distribution. (b,c) are final snapshots at t = 200 ns. Carbon (cyan), oxygen (red), nitrogen (blue) and phosphorous (tan) in head groups are shown using spheres while the lipid tails are shown as dynamic-bonds. Xenon and neon molecules are depicted as green and yellow balls. Water molecules are omitted for clarity. The images are created by VMD software.

