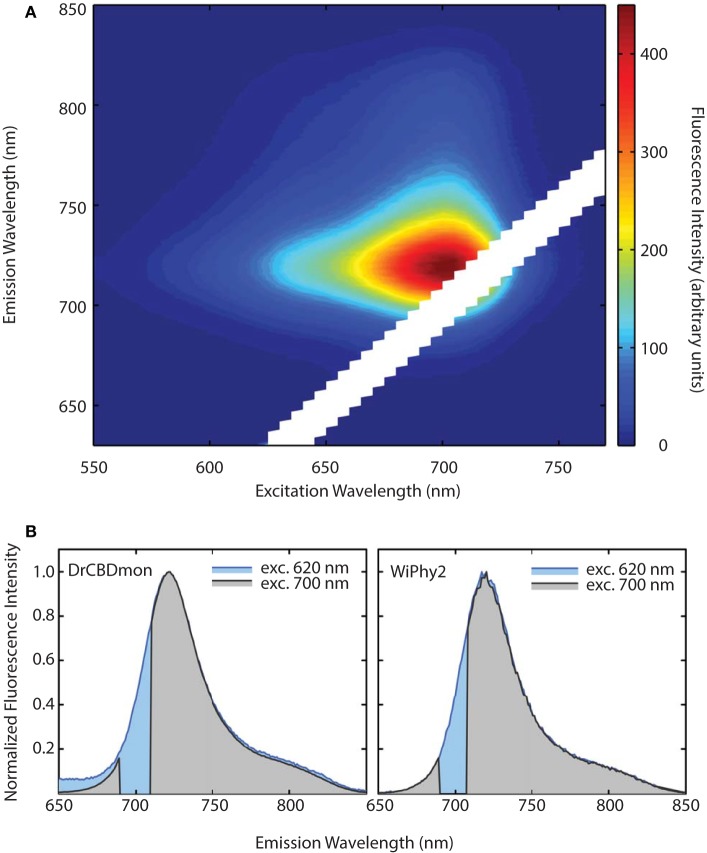
Figure 6.
(A) Excitation-Emission Matrix (EEM) for WiPhy2 represents fluorescence as a function of both excitation and emission wavelengths. Fluorescence intensities are corrected with the number of absorbed photons. (B) Two extracted excitation wavelengths (620 nm and 700 nm) are compared for DrCBDmon (left) and WiPhy2 (right).

