
Figure 3. The top 10 most frequent UMLS semantic types represented in the SemanticVExtractor data output, graphed by total counts.
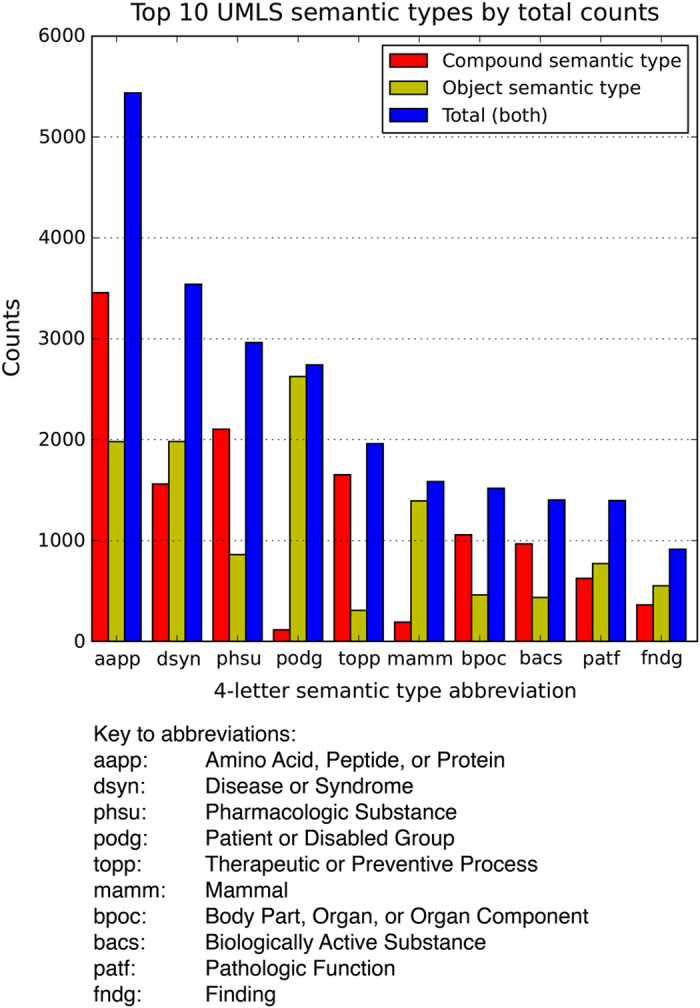
Shown separately are counts for compound semantic types, object semantic types, and the sum of both, each plotted in separate colors as indicated by the figure legend. The x-axis lists each of the top 10 UMLS semantic types by their 4-letter abbreviation, for ease of plotting. Each abbreviation is defined beneath the plot, in descending order of frequency.