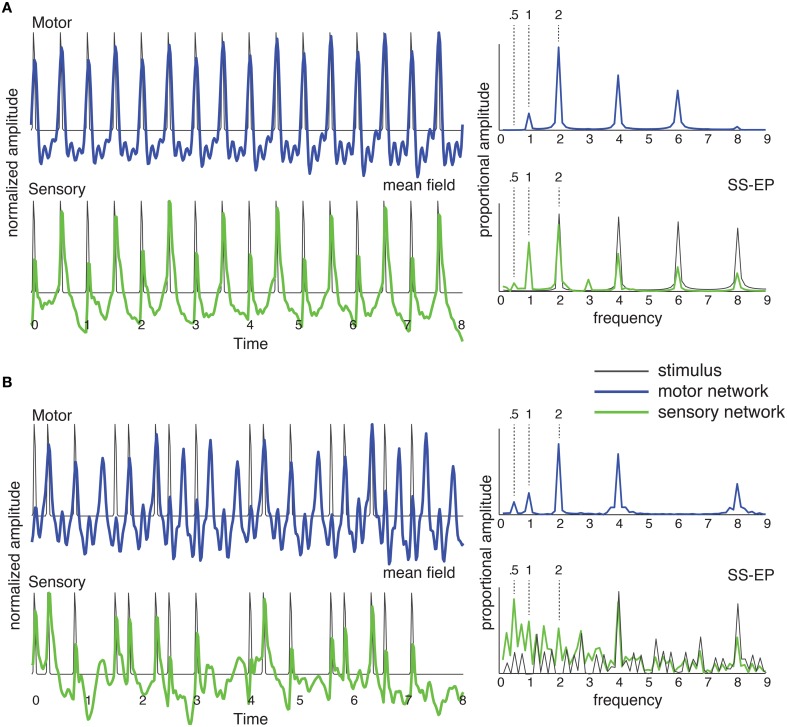
Figure 5.
The network of Figure 4C was stimulated with (A) an isochronous rhythm and (B) a “missing pulse” rhythm. Output of the sensory network is in green and output of the motor network is in blue. The mean field time series (left) was obtained by summing the output of all the oscillators in the network over time. The SS-EP is obtained by Fourier analysis (DFT) of the mean field time series. DFT of the stimulus envelope is shown in black on the sensory SS-EP axis.

