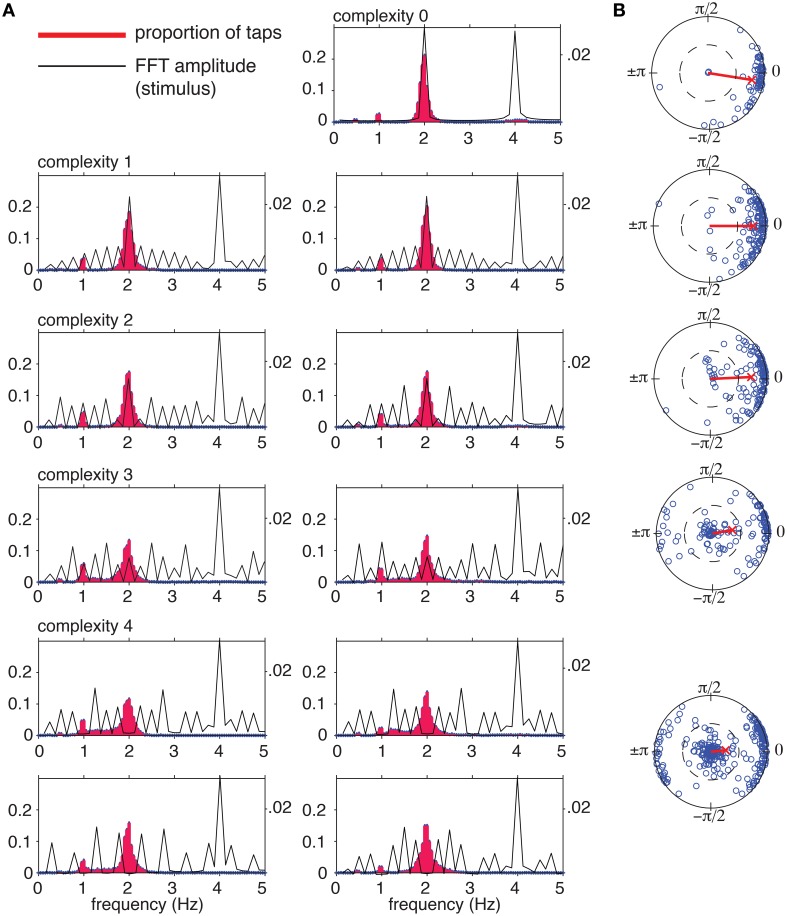
Figure 7.
(A) Tapping frequencies were normalized to a 2 Hz (120 bpm) tempo to allow comparison between trials at different tempos. Tapping frequency distributions (red histograms) were computed by binning normalized instantaneous tapping frequencies from 0 to 5.00 Hz in bin widths of 0.05 Hz. Distributions were computed for each rhythm separately, including every tap interval across trials. Black lines show amplitude spectrum of the stimulus envelope for comparison. (B) Circular means of tap phases for each trial (blue circles) and grand mean for each complexity level (red line).

