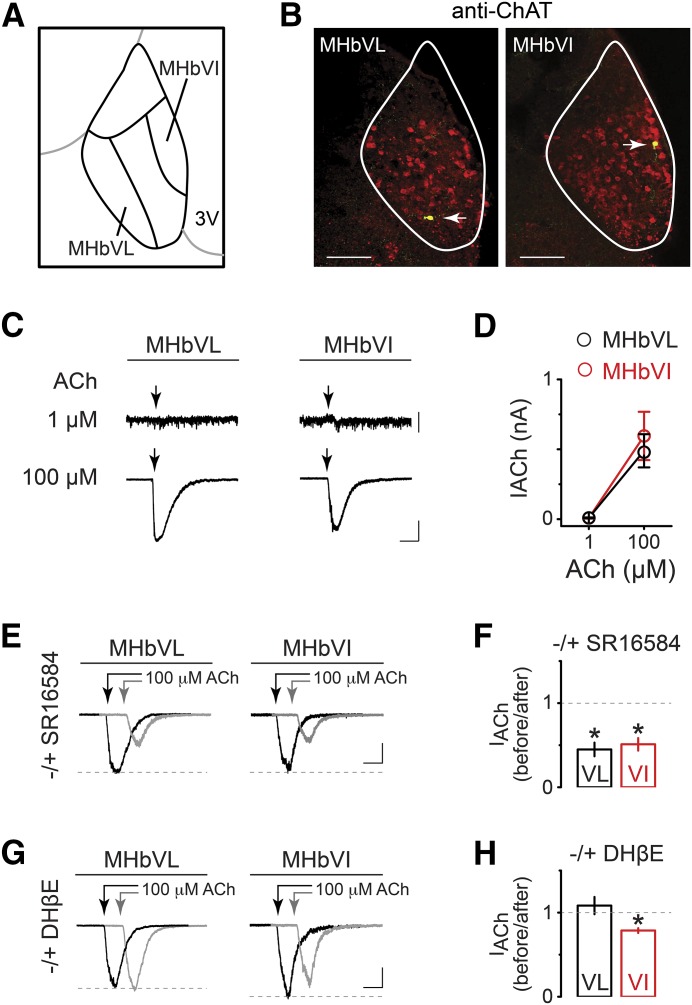
Fig. 1.
Functional differences in nAChRs between MHbVL and MHbVI neurons. (A) Schematic diagram defining a third of the ventrolateral portion of MHb as MHbVL and a third of the ventroinferior portion of MHb as MHbVI. (B) Locations of recorded cells in MHbVL and MHbVI were visualized by intracellular biocytin staining (green) and immunostaining for ChAT (red). Yellow cells (white arrow) are double-labeled cells. Representative data from labeled cells in MHbVL (left panel) and MHbVI (right panel) are shown. Scale bar: 100 μm. (C) Examples of currents evoked by 1 and 100 μM acetylcholine (250-millisecond puffs) in MHbVL. Scale bar: 10 pA (1 μM ACh) and 200 pA (100 μM ACh), 500 milliseconds. (D) Summary plot of peak ACh-evoked currents at the indicated concentrations in MHbVL and MHbVI neurons. (E) Representative traces showing 100 μM ACh-induced current before (black trace) and 15 minutes after (gray trace; offset for clarity) application of SR16584 (20 μM). Arrows indicate ACh applications. Scale bar: 250 pA, 350 milliseconds (MHbVL); 150 pA, 350 milliseconds (MHbVI). (F) Summary bar graphs are plotted to indicate the degree of inhibition (i.e., the fraction of control current remaining after application of SR16584); *p < 0.05 (paired t test). (G) Representative traces showing 100 μM ACh-induced current before (black trace) and 15 minutes after (gray trace; offset for clarity) application of DHβE (500 nM). Arrows indicate ACh applications. Scale bar: 250 pA, 350 milliseconds (MHbVL); 200 pA, 350 milliseconds (MHbVI). (H) Summary bar graphs are plotted to indicate the degree of inhibition (i.e., the fraction of control current remaining after application of DHβE); *p < 0.05 (paired t test).

