Fig. 2.
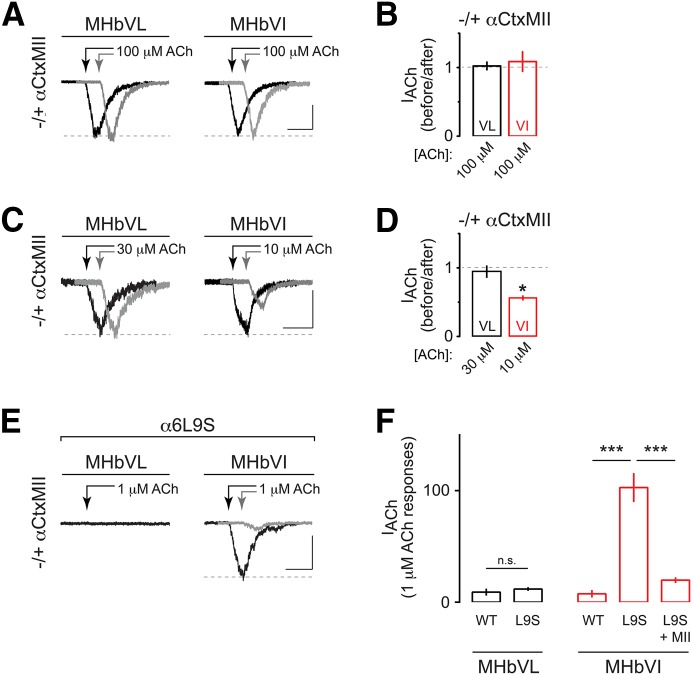
Functional α6* nAChR expression is specific to MHbVI. (A) Representative traces showing 100 μM–induced currents in MHbVL and MHbVI neurons before (black trace) and 15 minutes after (gray trace; offset for clarity) application of αCtxMII (100 nM). Arrows indicate ACh applications. Scale bar: 100 pA, 500 milliseconds (MHbVL); 90 pA, 500 milliseconds (MHbVI). (B) Summary bar graphs to indicate the degree of inhibition by αCtxMII (i.e., the fraction of control current remaining after application of αCtxMII) for ACh-evoked responses in MHbVL and MHbVI neurons. (C) Representative traces showing 30 μM (for MHbVL neurons) or 10 μM (for MHbVI neurons) ACh-evoked currents before (black trace) and after (gray trace; offset for clarity) application of αCtxMII (100 nM). Different ACh concentrations were used in MHbVL versus MHbVI based on the minimum ACh concentration that evoked workable inward currents. Scale bar: 50 pA, 500 milliseconds (MHbVL); 60 pA, 500 milliseconds (MHbVI). (D) Summary bar graphs to indicate the degree of inhibition by αCtxMII (i.e., the fraction of control current remaining after application of αCtxMII) for 30 μM (MHbVL) or 10 μM (MHbVI) ACh-evoked responses; *p < 0.05 (paired t test). (E) Representative traces for 1 μM ACh-evoked currents in MHbVL and MHbVI cells in slices from α6L9S mice. MHbVI cells, which responded robustly to 1 μM ACh (black trace), were subsequently exposed to αCtxMII (100 nM), and 1 μM ACh-evoked currents were measured in the presence of αCtxMII (gray trace). Scale bar: 70 pA, 500 milliseconds. (F) Summary bar graphs to indicate the average 1 μM ACh-evoked current response amplitude in MHbVL and MHbVI neurons in slices from α6L9S and nontransgenic control littermate (WT) mice; ***p < 0.001 (one-way ANOVA, Tukey’s post hoc test).

