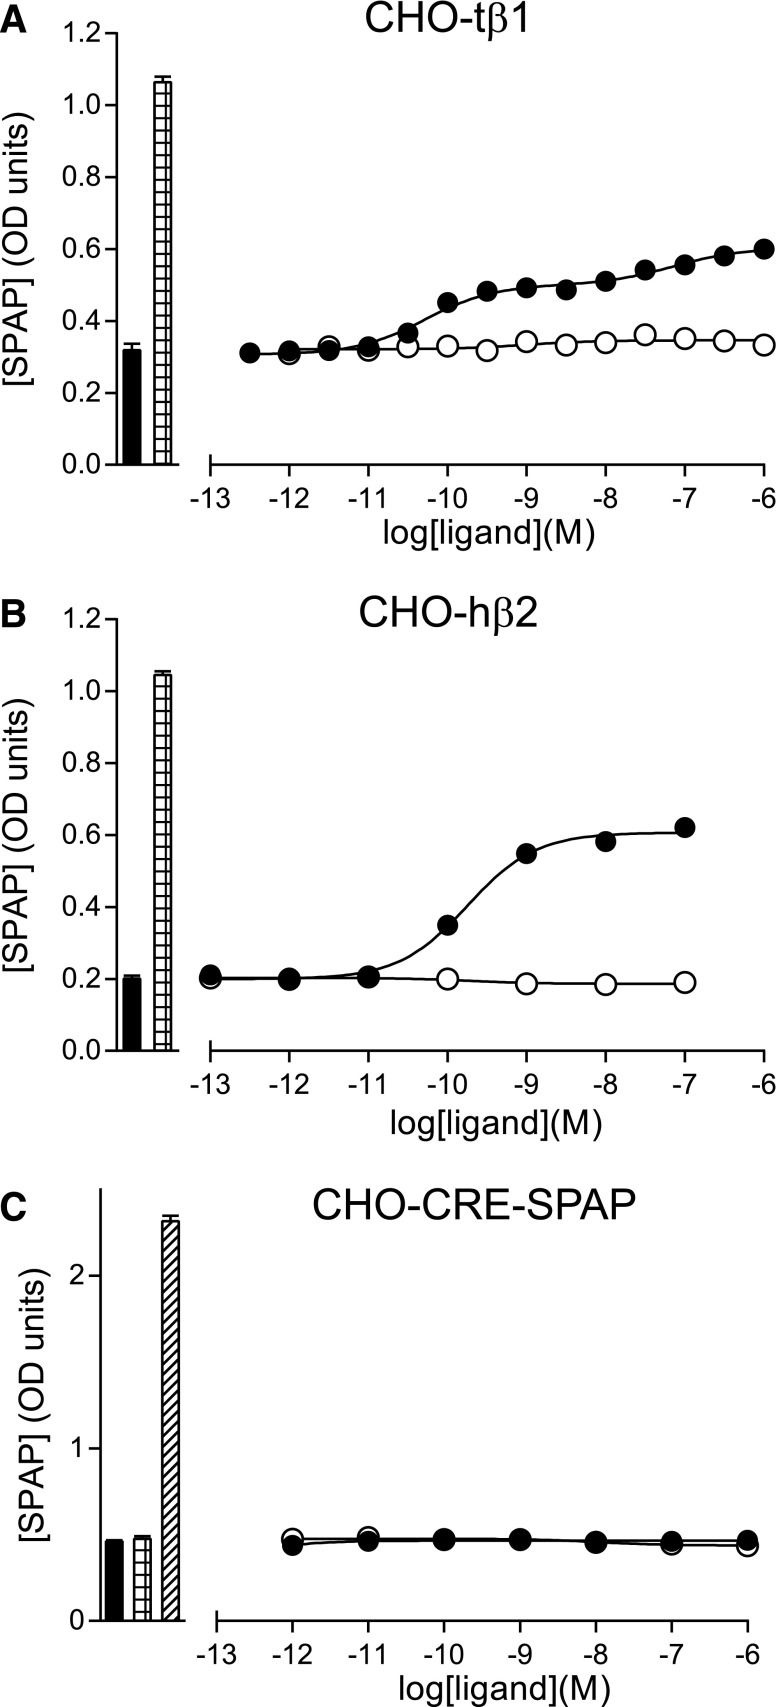
Fig. 5.
CRE-SPAP production in response to 7-methylcyanopindolol and cyanopindolol. (A) CHO cells stably expressing the turkey β1AR (CHO-tβ1), (B) CHO-hβ2 cells, and (C) CHO-CRE-SPAP cells (parental cells without the transfected receptor) were treated with either cyanopindolol (filled circles) or 7-methylcyanopindolol (open circles), and the amount of secreted placental alkaline phosphatase was measured. Log EC50 values are given in Tables 2 and 3. Bars to the left of the graphs represent either basal CRE-SPAP production in the absence of the ligand (filled bar) or the response to 10 µM of isoprenaline (hatched bar). In the parental cell line (C), forskolin was used as the positive control (diagonal hatching of the bar). Data points are mean ± S.E.M. of triplicate determinations. These single experiments are representative of (A) eight, (B) eight, and (C) four separate experiments. Error bars are shown, but are smaller than the size of the symbols.

