FIGURE 1.

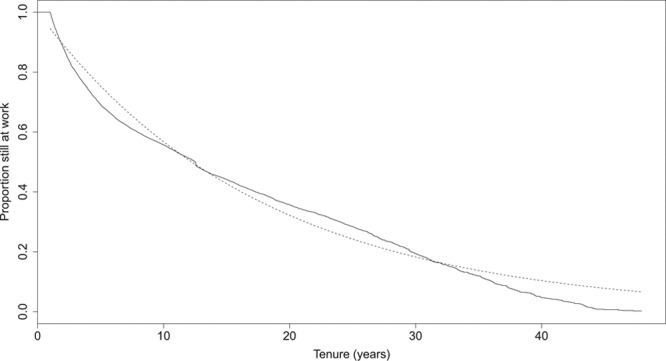
Time to termination of employment curve in the DEMS ever-underground subcohort (solid line), compared with a parametric exponential survival function with hazard λ = 0.06 (dashed line).

Time to termination of employment curve in the DEMS ever-underground subcohort (solid line), compared with a parametric exponential survival function with hazard λ = 0.06 (dashed line).