
Fig. 3.
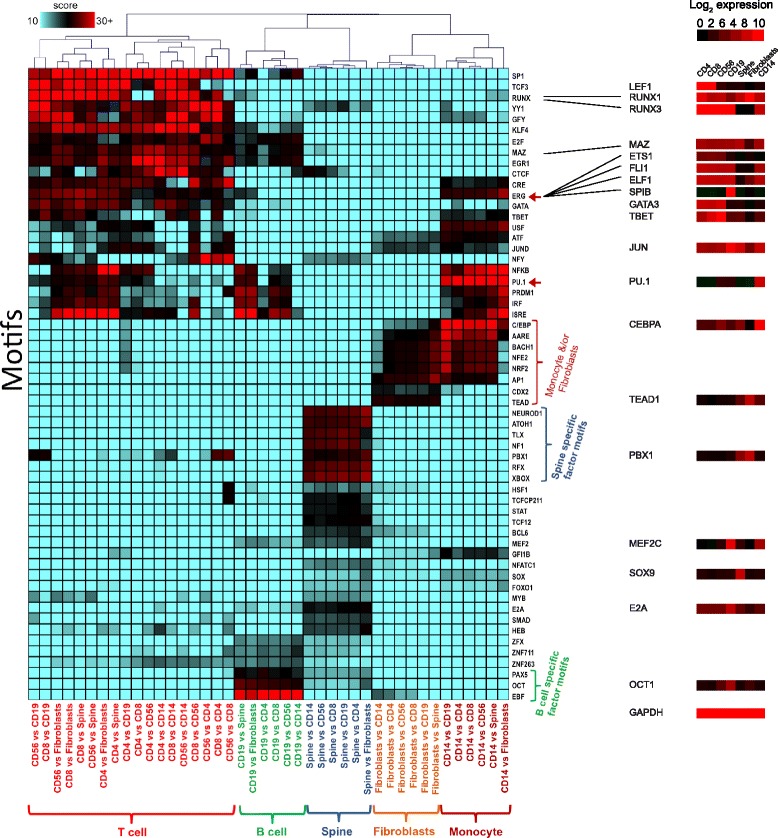
Analysis of differential footprints in the haematopoietic system reveals cell-type specific transcription factor networks. Differential footprints in 42 pairs of cell types and matches to known motifs inside differential footprints were determined using DNase-seq data from the NIH Roadmap Epigenomics project. Coloured boxes represent motif frequency with red indicating higher than average frequency. Hierarchical clustering was applied to rows and columns. Red arrows highlight members of the ETS family of transcription factors. BioGPS gene expression of typical tissue-specific TFs corresponding to motifs enriched in DFPs is shown to the right, with GAPDH as a positive control (bottom). The result correctly groups cell types and reveals known and likely regulatory factors