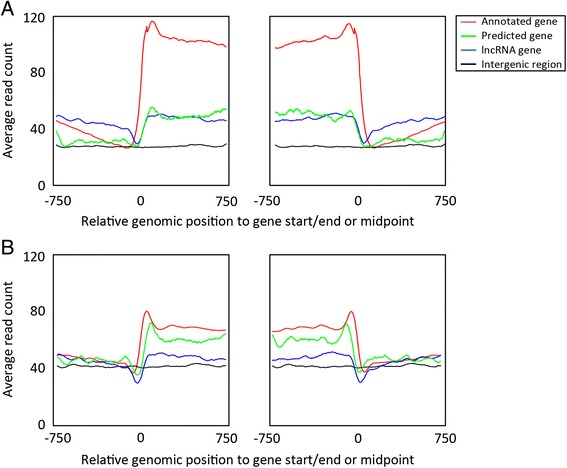
Fig. 4.

Nucleosome positioning profile around predicted genes. a Average sequence coverage profiles around the start (left panel) and the end of genes (right panel) for annotated protein-coding genes (red), published lncRNA genes (blue) and predicted novel genes identified in this study (green) in the nucleosome occupancy data set from Bunnik et al. [22] (data set B1). The average nucleosome occupancy in intergenic regions is presented as a reference (black). b Similar analysis for the nucleosome occupancy data set from Bartfai et al. [30] (data set B2). In all windows, the genomic position indicated on the x-axis is relative to the location of the gene start/end, or to the midpoint of intergenic windows
