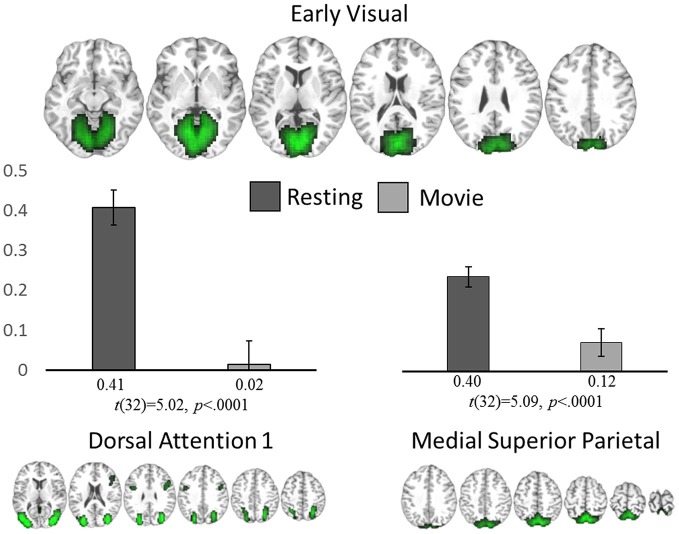
Figure 3.
ICA analysis. Significant network-level changes between rest and movie watching using data-driven ICA analysis. The average connectivity value between the early visual network (top) to both the dorsal attention (bottom left) and medial superior parietal networks (bottom right) are shown for both resting state (dark gray) and movie watching (light gray).

