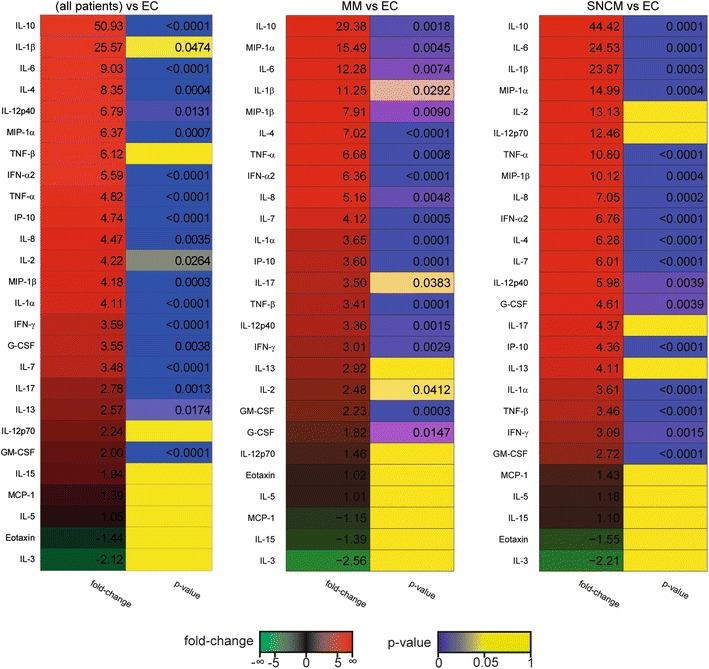
Fig. 2.

Heatmaps of observed fold-changes in cytokine concentrations in malaria groups as compared to endemic controls. Each panel shows a heatmap of the observed fold-change in cytokine concentration in the plasma for all patients and for particular subgroups of malarial patients with respect to the indicated control group. Heatmaps were sorted by fold-change values. Associated p values obtained using the Student’s t test are also indicated
