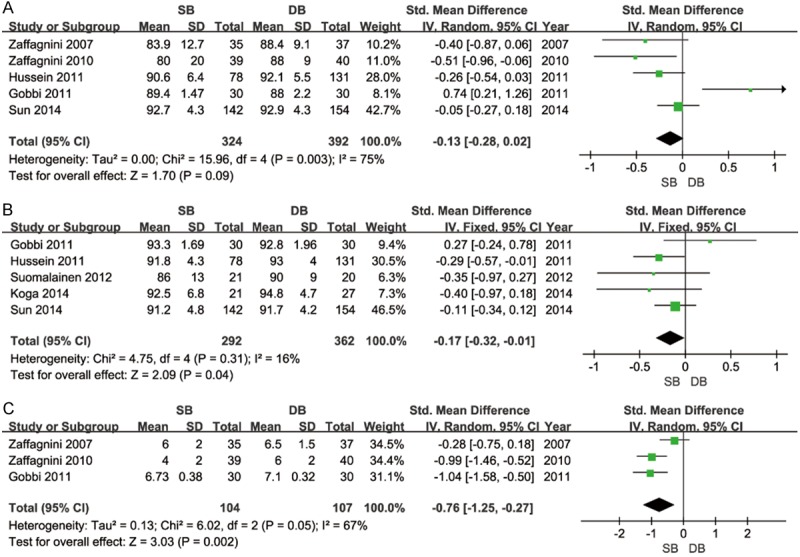
Figure 3.

Secondary outcomes after meta-analysis. A. Forest plot to assess subjective IKDC scores between two treatment strategies; B. Forest plot to assess Lysholm Score between two treatment strategies; C. Forest plot to assess Tegner Scale between two treatment strategies.
