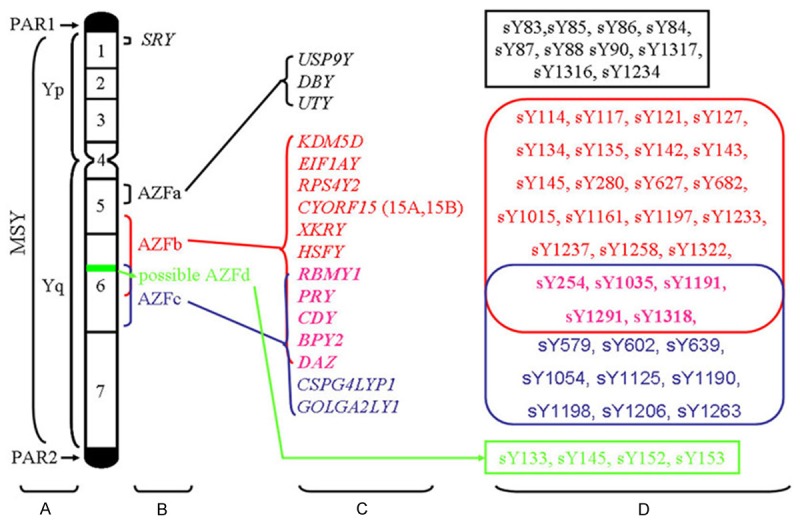
Figure 1.

Diagram of the human Y chromosome showing the AZF loci, associated genes and STS markers. A. Schematic representation of the structure of the human Y chromosome showing the pseudo autosomal regions (PAR1, PAR2), Yp (short arm), Yq (long arm) and MSY (male specific region). B. Schematic locations of the four AZF loci. C. Corresponding candidate genes in the AZFa, AZFb and AZFc regions. The black, red, blue and pink colors represent the genes in the AZFa, AZFb, AZFc and overlapping AZFb/AZFc regions, respectively. D. Conventional STS markers associated with the AZFa, AZFb, AZFc and AZFd regions. The black, red, blue, pink and green colors represent the STS markers for the genes in the AZFa, AZFb, AZFc, overlapping AZFb/AZFc and AZFd regions, respectively.
