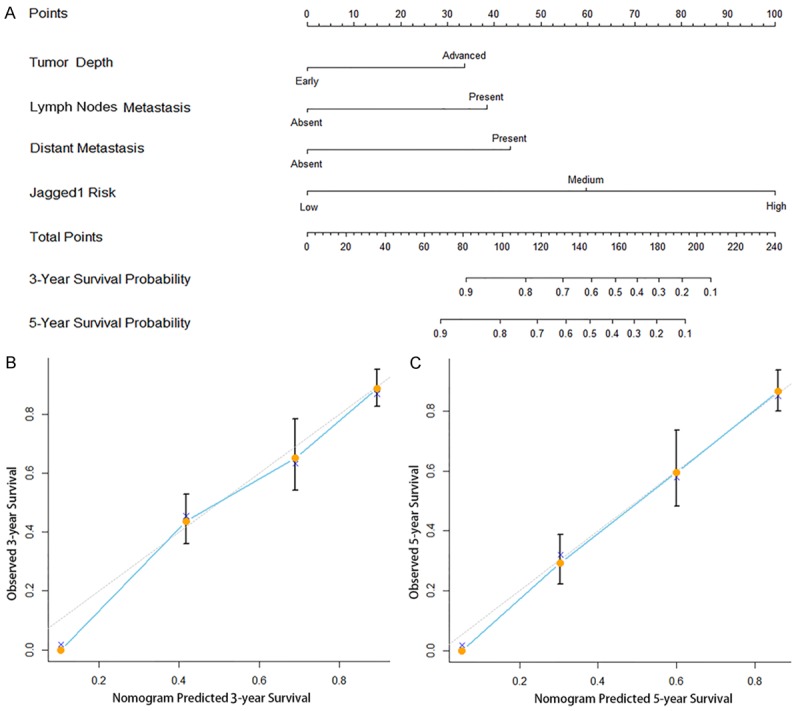
Figure 4.

Nomogram for predicting 3- and 5-year overall survival in patients with gastric cancer. A. Nomogram for predicting clinical outcomes integrated with Jagged1 risk (High/Medium/Low), tumor depth (Early =T1+2/Advanced =T3+4), lymph nodes metastasis (Absent/Present) and distant metastasis (Absent/Present), B. Calibration plot for nomogram predicted and observed 3-year survival rate, C. Calibration plot for nomogram predicted and observed 5-year survival rate. Line of dashes: ideal model; vertical bars, 95% confident interval. In the nomogram, higher total point predicts worse prognosis. The total point was raised by the addition of tumor depth (rang from 0 to 34), lymph nodes metastasis (rang from 0 to 38), distant metastasis (rang from 0 to 43) and Jagged1 risk (0 for “Low”, 60 for “Medium” and 100 for “High”) for each patients correspondingly. The nomogram predicted 3- or 5-year survival with more accuracy than TNM stage alone shown in the calibration curves.
