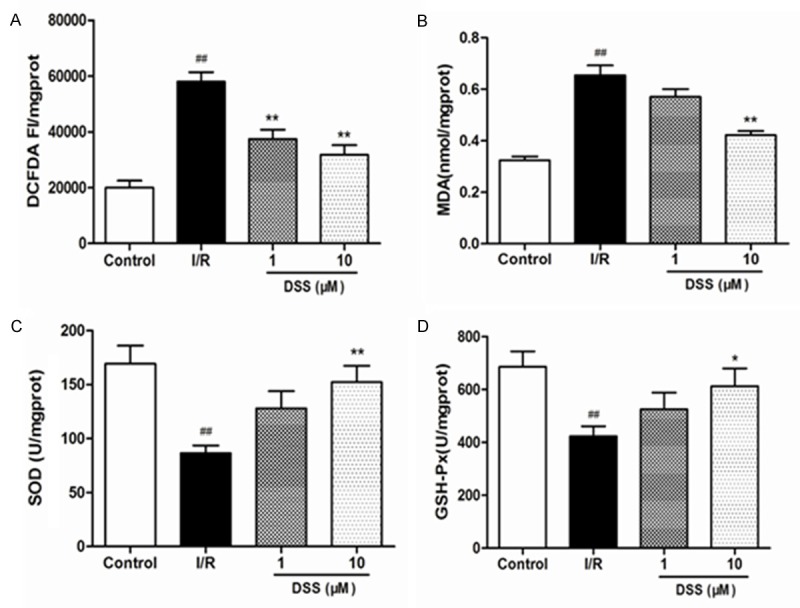
Figure 5.

Effects of DSS on the contents of ROS, MDA, SOD, and GSH activity after 30 min reperfusion in isolated hearts homogenate. A. The content of ROS; B. The content of MDA; C. The activity of SOD; D. The activity of GSHPX. Data expressed as mean ± SD, n = 6. #P < 0.05, ##P < 0.01 versus Control group. **P < 0.01 versus I/R group.
