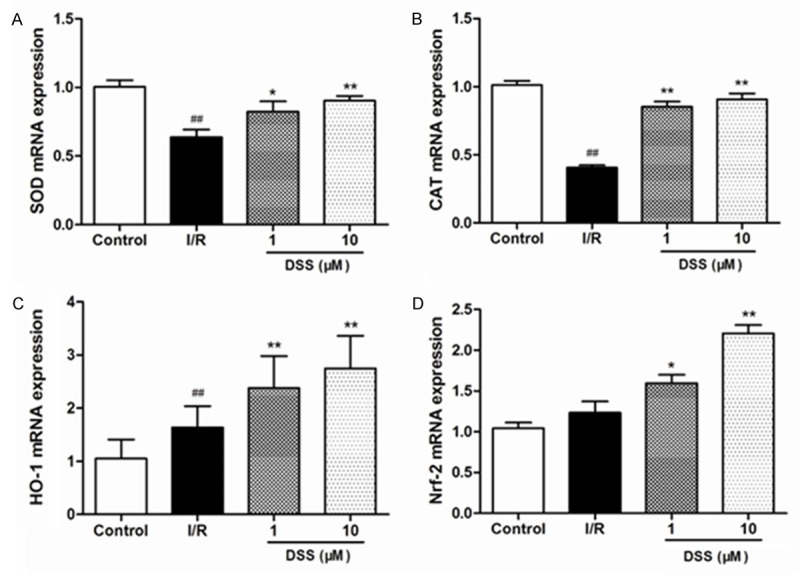
Figure 6.

Evaluation of anti-oxidant enzymes by RT-PCR after 30 min reperfusion in isolated hearts pretreated with DSS at 1 and 10 μM. The data were normalized to GAPDH. A. The expression of Cu/Zn SOD mRNA; B. The expression of CAT mRNA; C. The expression of HO-1 mRNA; D. The expression of Nrf2 mRNA. Data expressed as mean ± SD, n = 6. #P < 0.05, ##P < 0.01 versus Control group. **P < 0.01 versus I/R group.
