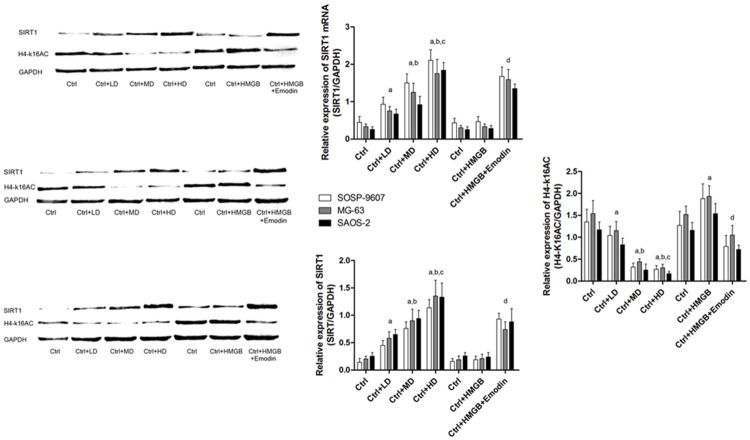
Figure 4.
Effects of emodin and HMGB incubation on SIRT1 expression and deacetylase activity in human OS cells. Left part of this figure demonstrated the immunoblots of SIRT1 and H4-k16AC in human OS cells including SOSP-9607, MG-63 and SAOS-2 cells respectively. Upper part of the right part of this figure showed the mRNA levels in human OS cells. Ctrl: human OS cells; Ctrl+LD: human OS cells incubated with 2.5 μmol/L emodin; Ctrl+MD: human OS cells incubated with 5 μmol/L emodin; Ctrl+HD: human OS cells incubated with 10 μmol/L emodin. aDifferences were significantly from Ctrl; bdifferences were significantly from Ctrl+LD; cdifferences were significantly from Ctrl+MD; ddifferences were significantly from Ctrl+HMGB.

