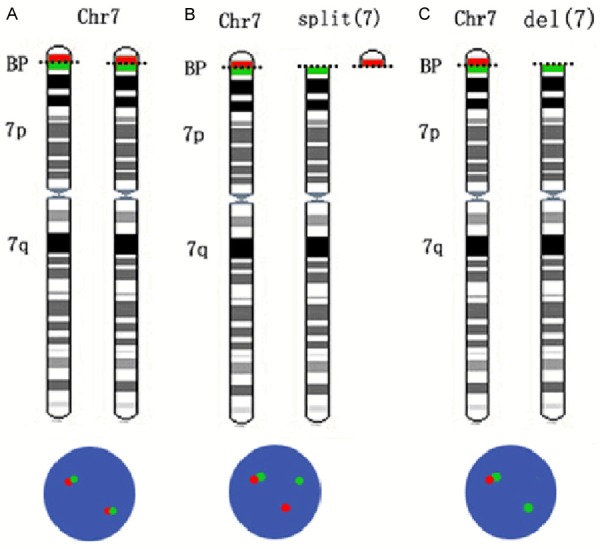
Figure 1.

Schematic presentation of the detection of SDK1 rearrangements. A. A cell with normal SDK1 shows two pairs of green and red signals. B. Red and green signals split apart when a break at SDK1 occurs with both chromosome fragments remaining in the cell. C. Loss of green signal when the 3’ region of SDK1 is deleted. Chr: chromosome; BP: breakpoint.
