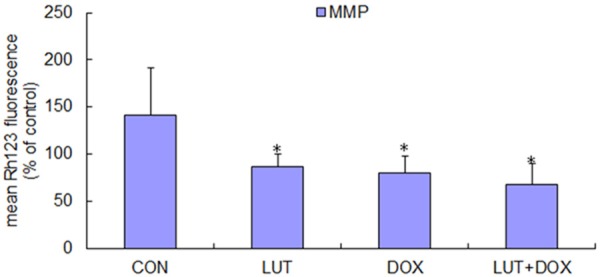
Figure 2.

Effects of combined treatment with LUT and DOX on MMP levels. U2OS cells were grown at a concentration of 1×10⁶ cells/ml, and then treated with 100 µM LUT, 100 µM DOX, 100 µM DOX plus 100 µM LUT for 24 h (PBS as a bank control). After three washes, cells were incubated for 37°C for 30 min with 10 µM Rh123 in PBS. The fluorescencewasmeasured using flowcytometry (excitation wavelengths were both 488 nm, and emission wavelengths were both 525 nm). Each bar represents the mean ± SD from three experiments (*P < 0.05 versus PBS control).
