
Figure 1.
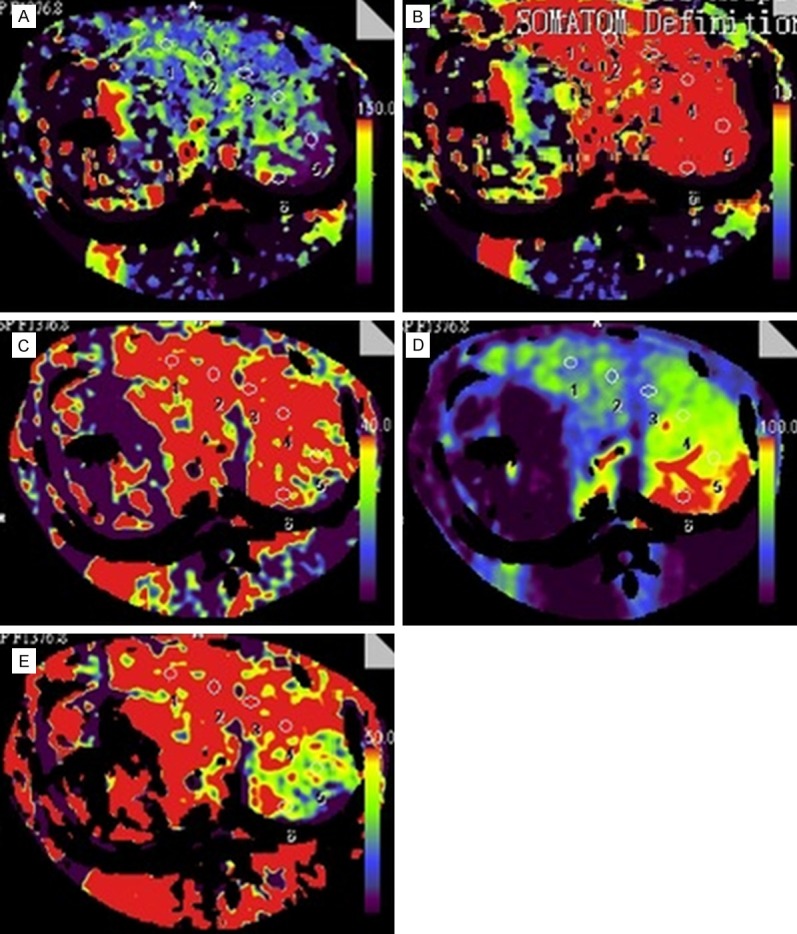
Transverse CT perfusion maps of BF (A), BV (B), ALP (C), PVP (D) and HPI (E) in a rabbit with F3 stage of liver fibrosis. Six ROIs were measured in the selected plane. The mean parametric indexes were as follow: BF, 69.26 ml min (-1) 100 ml (-1); BV, 24.09 ml min (-1) 100 ml (-1); ALP, 74.83 ml min (-1) 100 ml (-1); PVP, 68.19 ml min (-1) 100 ml (-1); HPI, 52.44%.