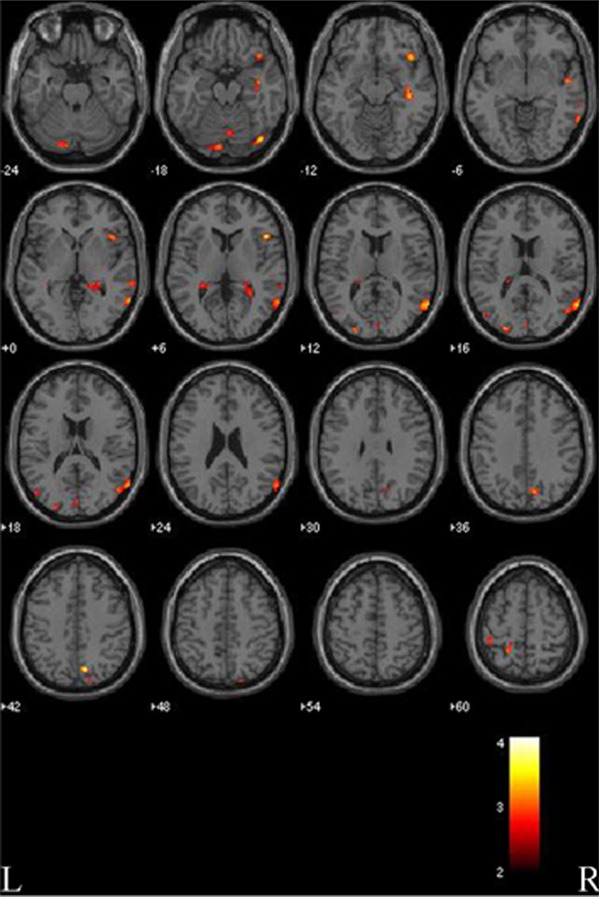
Figure 1.

Gray matter reductions in patients with Parkinson’s disease (PD) compared to normal controls (NC). VBM analysis revealed significant changes are found in the temporal, occipital, parietal, frontal lobes (both sides), hippocampus, parahippocampal gyrus and posterior lobe of the cerebellum (right side), and caudate nucleus (left side). L, left side; R, right side. The color bar represents the T score. Yellow presents a high T score.
