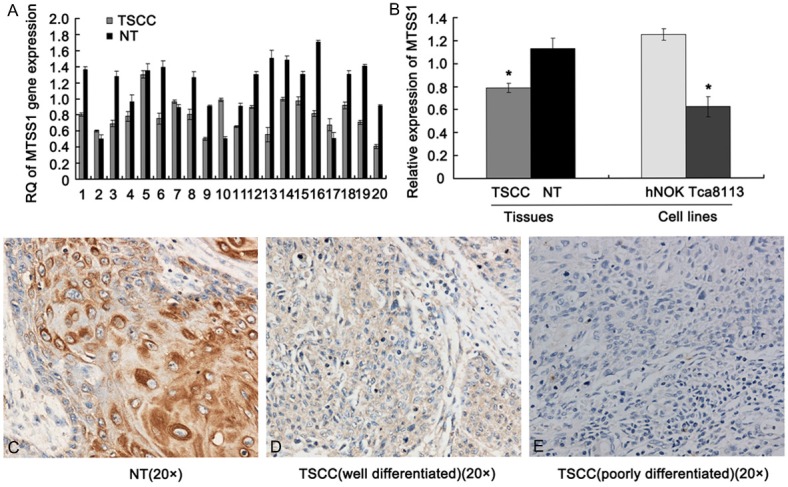
Figure 1.

MTSS1 is down-regulated in human TSCC. A. representative qRT-PCR results of MTSS1 gene expression in fifty TSCC and adjacent normal tissues. B. Statistic analysis results of MTSS1 gene expression in TSCC tissues and Tca8113 cell line. The results were shown as mean ± SD. *P < 0.05 versus adjacent normal tissues and hNOK cell line. C-E. representative immunohistochemical staining results of MTSS1 protein in fifty TSCC and adjacent normal tissues. C is adjacent normal tissues, D is well differentiated TSCC and E is poorly differentiated TSCC (SP, original magnification 200 ×).
