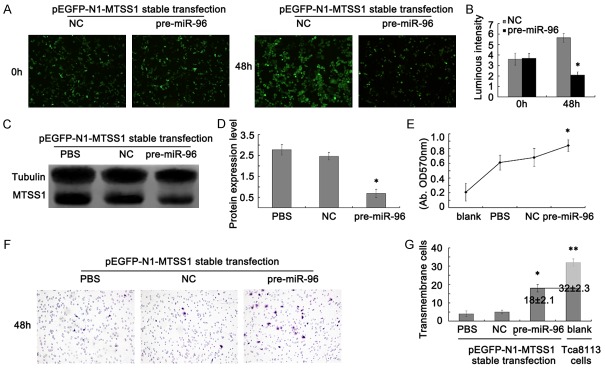
Figure 4.
MiR-96 regulates MTSS1 mediated Tca8113 cells proliferation and metastasis. A. Fluorescence microscope observation the expression of MTSS1 after pEGFP-N1-MTSS1 stable transfection in Tca8113 cells. B. Statistic Luminous intensity analysis of MTSS1 expression. The results were shown as mean ± SD. *P < 0.05. C and D. Western blot analysis results of MTSS1 protein expression in pEGFP-N1-MTSS1 stable transfected Tca8113 cells. Tubulin was used as a reference control. Quantitative analysis was done by measure the IVD of protein bands. The results were shown as mean ± SD. *P < 0.05. E. MTT assay after pre-miR-96 transfection into pEGFP-N1-MTSS1 stable expressed Tca8113 cells. The results were shown as mean ± SD. *P < 0.05. F. Transwell assay after pre-miR-96 transfection into pEGFP-N1-MTSS1 stable expressed Tca8113 cells (magnification, 200 ×). G. Statistic analysis of average invasive cell number of three independent experiments ± SD. *P < 0.05. 18 ± 2.1 and 32 ± 2.3 means trans-membrane cell numbers in pre-miR-96 transfected pEGFP-N1-MTSS1 stable expressed Tca8113 cells and Tca8113 cells transient transfected with pEGFP-N1-MTSS1 plasmid.

