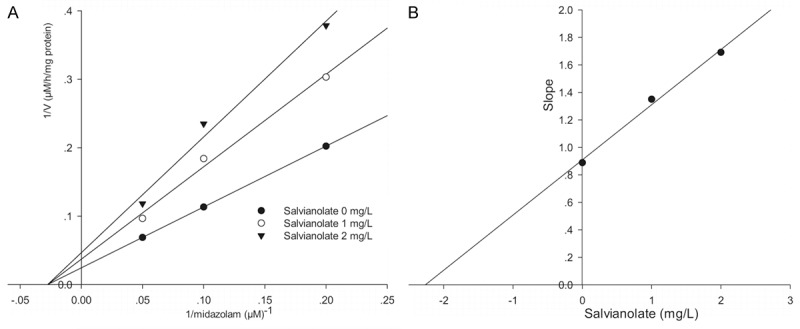
Figure 3.

Lineweaver-Burk plot (A) and secondary plot (B) obtained from a kinetic study of CYP3A4-catalyzed midazolam 1’-hydroxylation following a 30 min incubation with salvianolate at 0 (●), 1 (○), or 2 (▼) mg/L. The results shown are the means of triplicate experiments.
