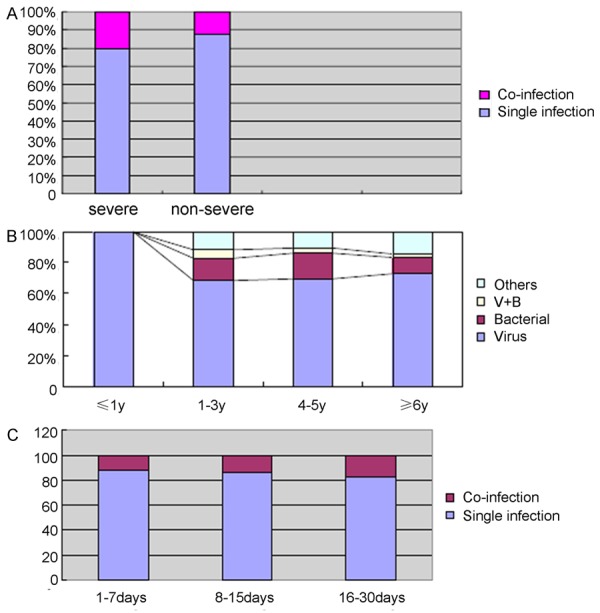
Figure 3.

Course distribution of co-infection in MPP. A. Percentage of co-infection in severe cases. B. Mixed bacterial, viral and bacterial/viral occurred in different age children with MPP: Distribution of pathogens in co-infecting MPP, stratified by age. C. Percentage of co-infection cases in different course of disease.
