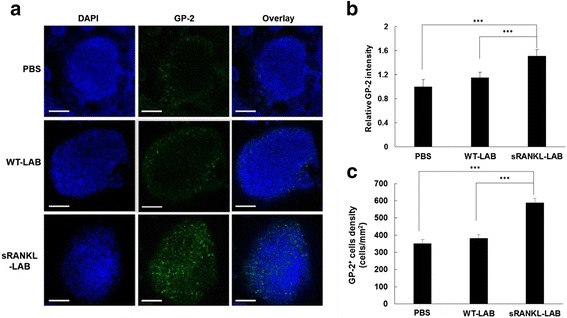
Fig. 4.

a Representative images for whole mount IHC of M cells in the FAE. At day 8 post-treatment of WT-LAB or sRANKL-LAB for consecutive 7 days, Peyer’s patches from mice of each group was isolated and stained with Alexa 488-labeled anti-GP-2, to observe M cell development. The nucleus was stained with DAPI. Scale bar represents 100 μm. b and c the GP-2+ intensity and the GP-2+ cell density in the FAE of each group were analyzed using ImageJ software. For significance tests, a one-way analysis of variance (ANOVA) followed by Tukey’s post-hoc test were used, and expressed as follows; *P < 0.05, **P < 0.01, ***P < 0.001
